The food cost percentage is the ratio between the cost of raw materials and the selling price of a product, expressed as a percentage. It is used to understand, at a glance, how much the ingredients "weigh" on the final price. The problem is that it is often treated as a fixed threshold to be respected at all times — and in an artisan workshop, where products are very different from one another, this leads to wrong decisions.
The formula
Food cost % = (raw material cost ÷ selling price) × 100
Example: a tart with €3.23 of raw materials sold at €12 has a food cost of 26.9%. So far the calculation is simple — the real question is: is 26.9% a good number for that product?
Why there is no single "ideal" number
The figure that circulates most often — a food cost between 25% and 35% — is an indicative reference for many food businesses, not a universal rule. In an artisan workshop the ideal food cost changes depending on:
- How much labour goes into the product. A product with cheap ingredients but long, manual preparation (decorating, assembly) can afford a low food cost, because the real cost shifts to labour.
- The sales channel. Wholesale and retail have different margins: in retail, where you have no intermediaries, you can sustain a lower food cost percentage while keeping the same absolute margin.
- The product's positioning. A premium raw material (e.g. a single-origin chocolate) can justify a higher food cost because it is part of the perceived value that the customer is happy to pay for.
- Perishability and waste. Fresh products with high physiological waste (fruit, fish) naturally have a higher food cost for the same margin, because part of the raw material never reaches the plate.
That is why comparing the food cost percentage of very different products — a tart and a decorated cake — almost always leads to wrong conclusions: they are two different cost structures, not two points on the same scale.
The limit of food cost percentage on its own
The food cost percentage only looks at raw materials. It says nothing about labour, packaging, energy, fixed costs — all items that, added to the food cost, make up the CPF (Costo Pieno di Fabbricazione, i.e. full production cost). Two products can have the same food cost percentage and completely different profit margins, if one requires much more labour than the other.
That is why the food cost percentage is useful as a quick indicator — above all for comparing the same product over time, when a supplier's price goes up — but the pricing decision must be made by looking at the full CPF, not just the food cost.
How to use it well, in practice
- Set a range per product family, not a single one for the whole catalogue: leavened products, dry baked goods and fresh garnished products have different cost structures, and it makes sense for their ranges to be different.
- Use it to compare the same product over time. If a product's food cost rises from 27% to 34% because a supplier has raised prices, it is a clear signal that the selling price needs to be reviewed — even if 34% is still "within" a plausible range.
- Don't use it alone to set the price. Start from the CPF (raw materials + labour + packaging + fixed costs) and apply a markup consistent with your positioning; the food cost percentage that results is a consequence, not the starting point.
A numerical example
| Product | Raw materials | Selling price | Food cost % |
|---|---|---|---|
| Jam tart | €3.23 | €12.00 | 26.9% |
| Custom decorated cake | €8.50 | €45.00 | 18.9% |
| Macarons (6 pcs) | €2.10 | €7.50 | 28.0% |
Three products, three different food cost percentages, all three plausible — because the decorated cake absorbs much more labour per piece, and it makes no sense to push it towards a higher food cost just to "align" it with the other two.
How KoreLab solves these problems
Almost all the limits seen above stem from a single cause: the food cost percentage calculated by hand on a spreadsheet, product by product, which goes out of date at the first price change. Here is, problem by problem, what KoreLab does, why it does it and what changes in your work.
1. You only look at raw materials, not the full cost
What KoreLab does
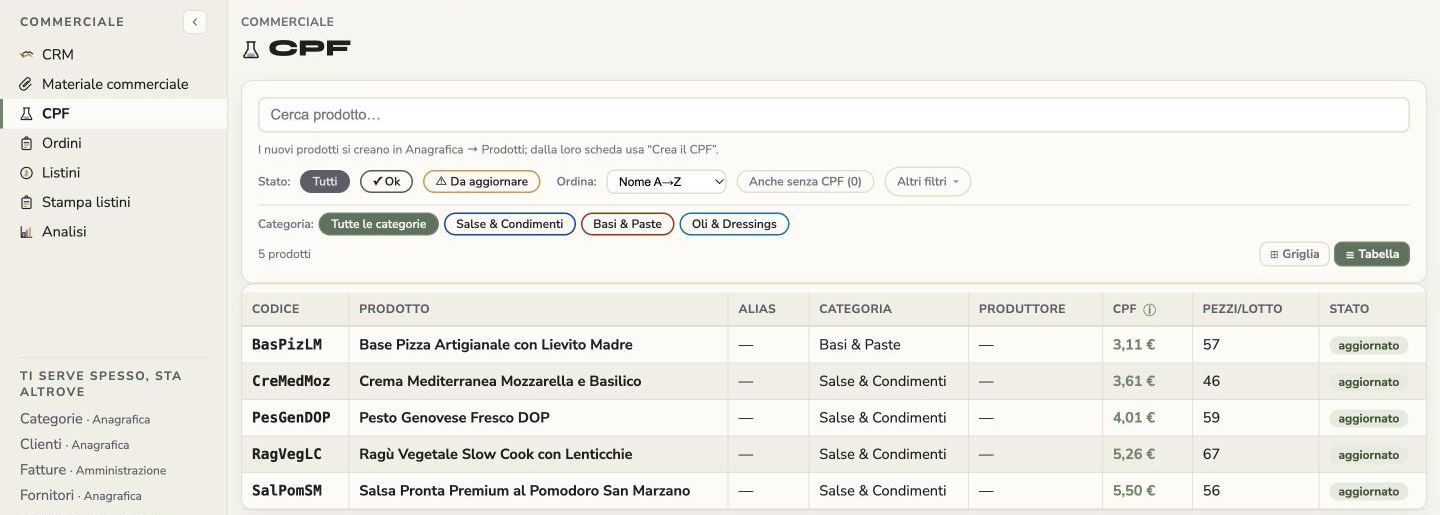
For each product KoreLab calculates the CPF — raw materials, labour, packaging and fixed costs — and the pieces per batch; from there you build the selling price lists.
Why it does it
The food cost percentage alone says nothing about how much labour a product absorbs, so it is not enough to set a price.
What it solves
You start from the full cost and the food cost percentage becomes a consequence of the price, not the starting point.
2. Different products, different cost structures
What KoreLab does
You organise the catalogue by categories (for example bases and doughs, sauces and condiments, oils and dressings) and filter the list by category and by status.
Why it does it
We have seen that a single range for the whole price list makes no sense; a range per product family does.
What it solves
You compare each product with those of its own family and not with a heterogeneous price list.
3. The supplier raises the price and you don't notice
What KoreLab does
When an ingredient's price changes, KoreLab recalculates the cost of the products that use it and flags those affected by the change.
Why it does it
A 7% increase on a raw material goes unnoticed until you look at the margin at the end of the month.
What it solves
You know right away which selling prices to review, instead of finding out when the margin has already dropped.
4. Comparing the same product over time
What KoreLab does
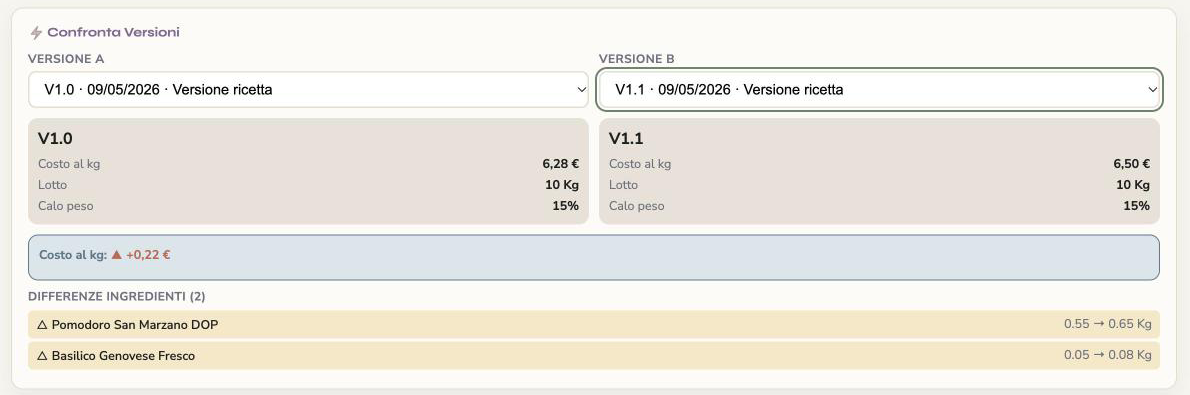
Each recipe has its versions and you can compare two of them: KoreLab shows cost per kg, batch, weight loss and changed ingredients.
Why it does it
Comparison over time is the most useful use of the food cost percentage, but it requires keeping the previous versions.
What it solves
You understand whether a cost has risen because of a recipe change or because of a supplier price change.
5. A catalogue of dozens of products
What KoreLab does
It keeps all products in a single sortable and filterable list, with always up-to-date numbers.
Why it does it
With one Excel sheet per product, every price increase means reopening and recalculating files one by one.
What it solves
Recalculation stops being manual work and the data you decide on is today's, not three months old.
You can start for free on your first products, no credit card required: create a free account.
In summary
There is no "ideal" food cost percentage that is the same for every product: it depends on labour, channel, positioning and waste. Use it to compare the same product over time and to catch supplier price increases, but set the price starting from the full CPF, not from food cost alone.